Debug an extension
Building and debugging a DevToys extension is a straightforward process. This guide will walk you through the necessary steps.
One-time configuration
Before you can debug your extension, there's a one-time configuration you need to complete:
- In the project your created, add a new folder named Properties.
- In the Properties folder, create a new file named launchSettings.json.
- Paste the following JSON into this file:
{
  "$schema": "https://json.schemastore.org/launchsettings.json",
  "profiles": {
    "DevToys GUI": {
      "commandName": "Executable",
      "executablePath": "%DevToysGuiDebugEntryPoint%",
      "environmentVariables": {
        "EXTRAPLUGIN": "$(TargetDir)"
      }
    },
    "DevToys CLI": {
      "commandName": "Executable",
      "executablePath": "%DevToysCliDebugEntryPoint%",
      "commandLineArgs": "",
      "environmentVariables": {
        "EXTRAPLUGIN": "$(TargetDir)"
      }
    }
  }
}
Assuming you've correctly set the DevToysGuiDebugEntryPoint and DevToysCliDebugEntryPoint environment variable as per the Setup steps, this JSON configuration will enable automatic startup of DevToys or DevToys CLI and pass your extension as an argument.
Build & Run
Now comes the exciting part! Once the above steps are completed, you should be able to press F5 in your editor (whether it's Visual Studio, Visual Studio Code, or JetBrains Rider) to start the debugger. Your project will build, then DevToys will start, and your extension will be loaded. The My Extension tool should be available in the list of tools. You can place a breakpoint in the extension, such as in the GetFontDefinitionsAsync method or View property, and your editor should pause the execution when invoked.
To debug a command line tool, use the DevToys CLI startup configuration. Change the commandLineArgs in your launchSettings.json to invoke the command and options you created.
Hot Reload
Hot Reload feature is supported in DevToys.
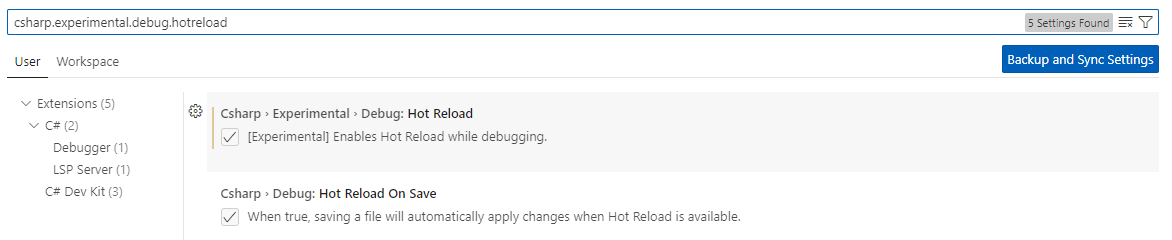
Hot Reload is enabled by default in Visual Studio 2022. In case, you can navigate to the menu Tools > Options and search for Hot Reload and verify whether the option is enabled.
Once Hot Reload is enabled in your editor, you will be able to edit your extension while debugging it and see the changes in live in DevToys.
General limitation
- Code changes will only be applied while actively debugging.
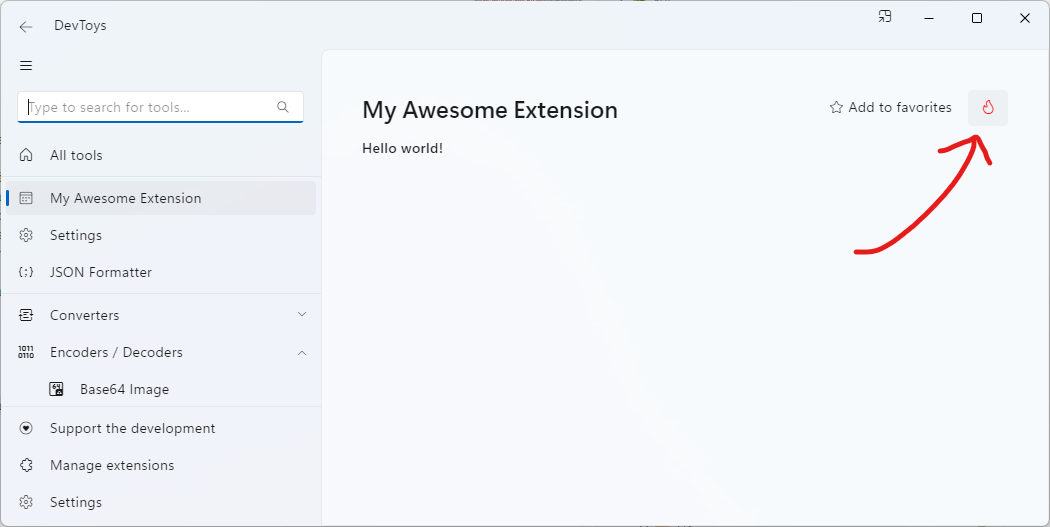
- Changes made to the user interface of a DevToys tool only applies when clicking the Hot Reload button in DevToys. This button ultimately unload the displayed UI and reload it from the updated code. This button only appears while DevToys is debugged.